Combat behavior was functional, but subjective play feel could not explain frame-time spikes or allocation pressure.
Case study · Performance engineering
Measure. Optimize. Verify.
Measure under repeatable conditions. Lucid Knight is a complete, shipped Unity 6 action RPG—dragon boss, parry combat, full combat loop—used here as an engineering testbed for a consistent performance workflow, not a collection of unmeasured “optimizations.”
RoleSolo developer
StackUnity 6 · C# · URP
FocusRuntime performance
MethodProfiler + custom telemetry
System boundary
The game, the observer, and the evidence stay separate.
Runtime systems produce behavior. Unity Profiler and custom telemetry observe it without becoming gameplay dependencies.
Every change returns to the same route and matching build conditions before a result is accepted.
- 01RecordCapture frame, GPU, and allocation evidence on the same combat route
- 02IsolateLocate one proven bottleneck
- 03ChangeApply one targeted fix
- 04VerifyRepeat under matching conditions
Measured result
A release-build improvement that can be reproduced.
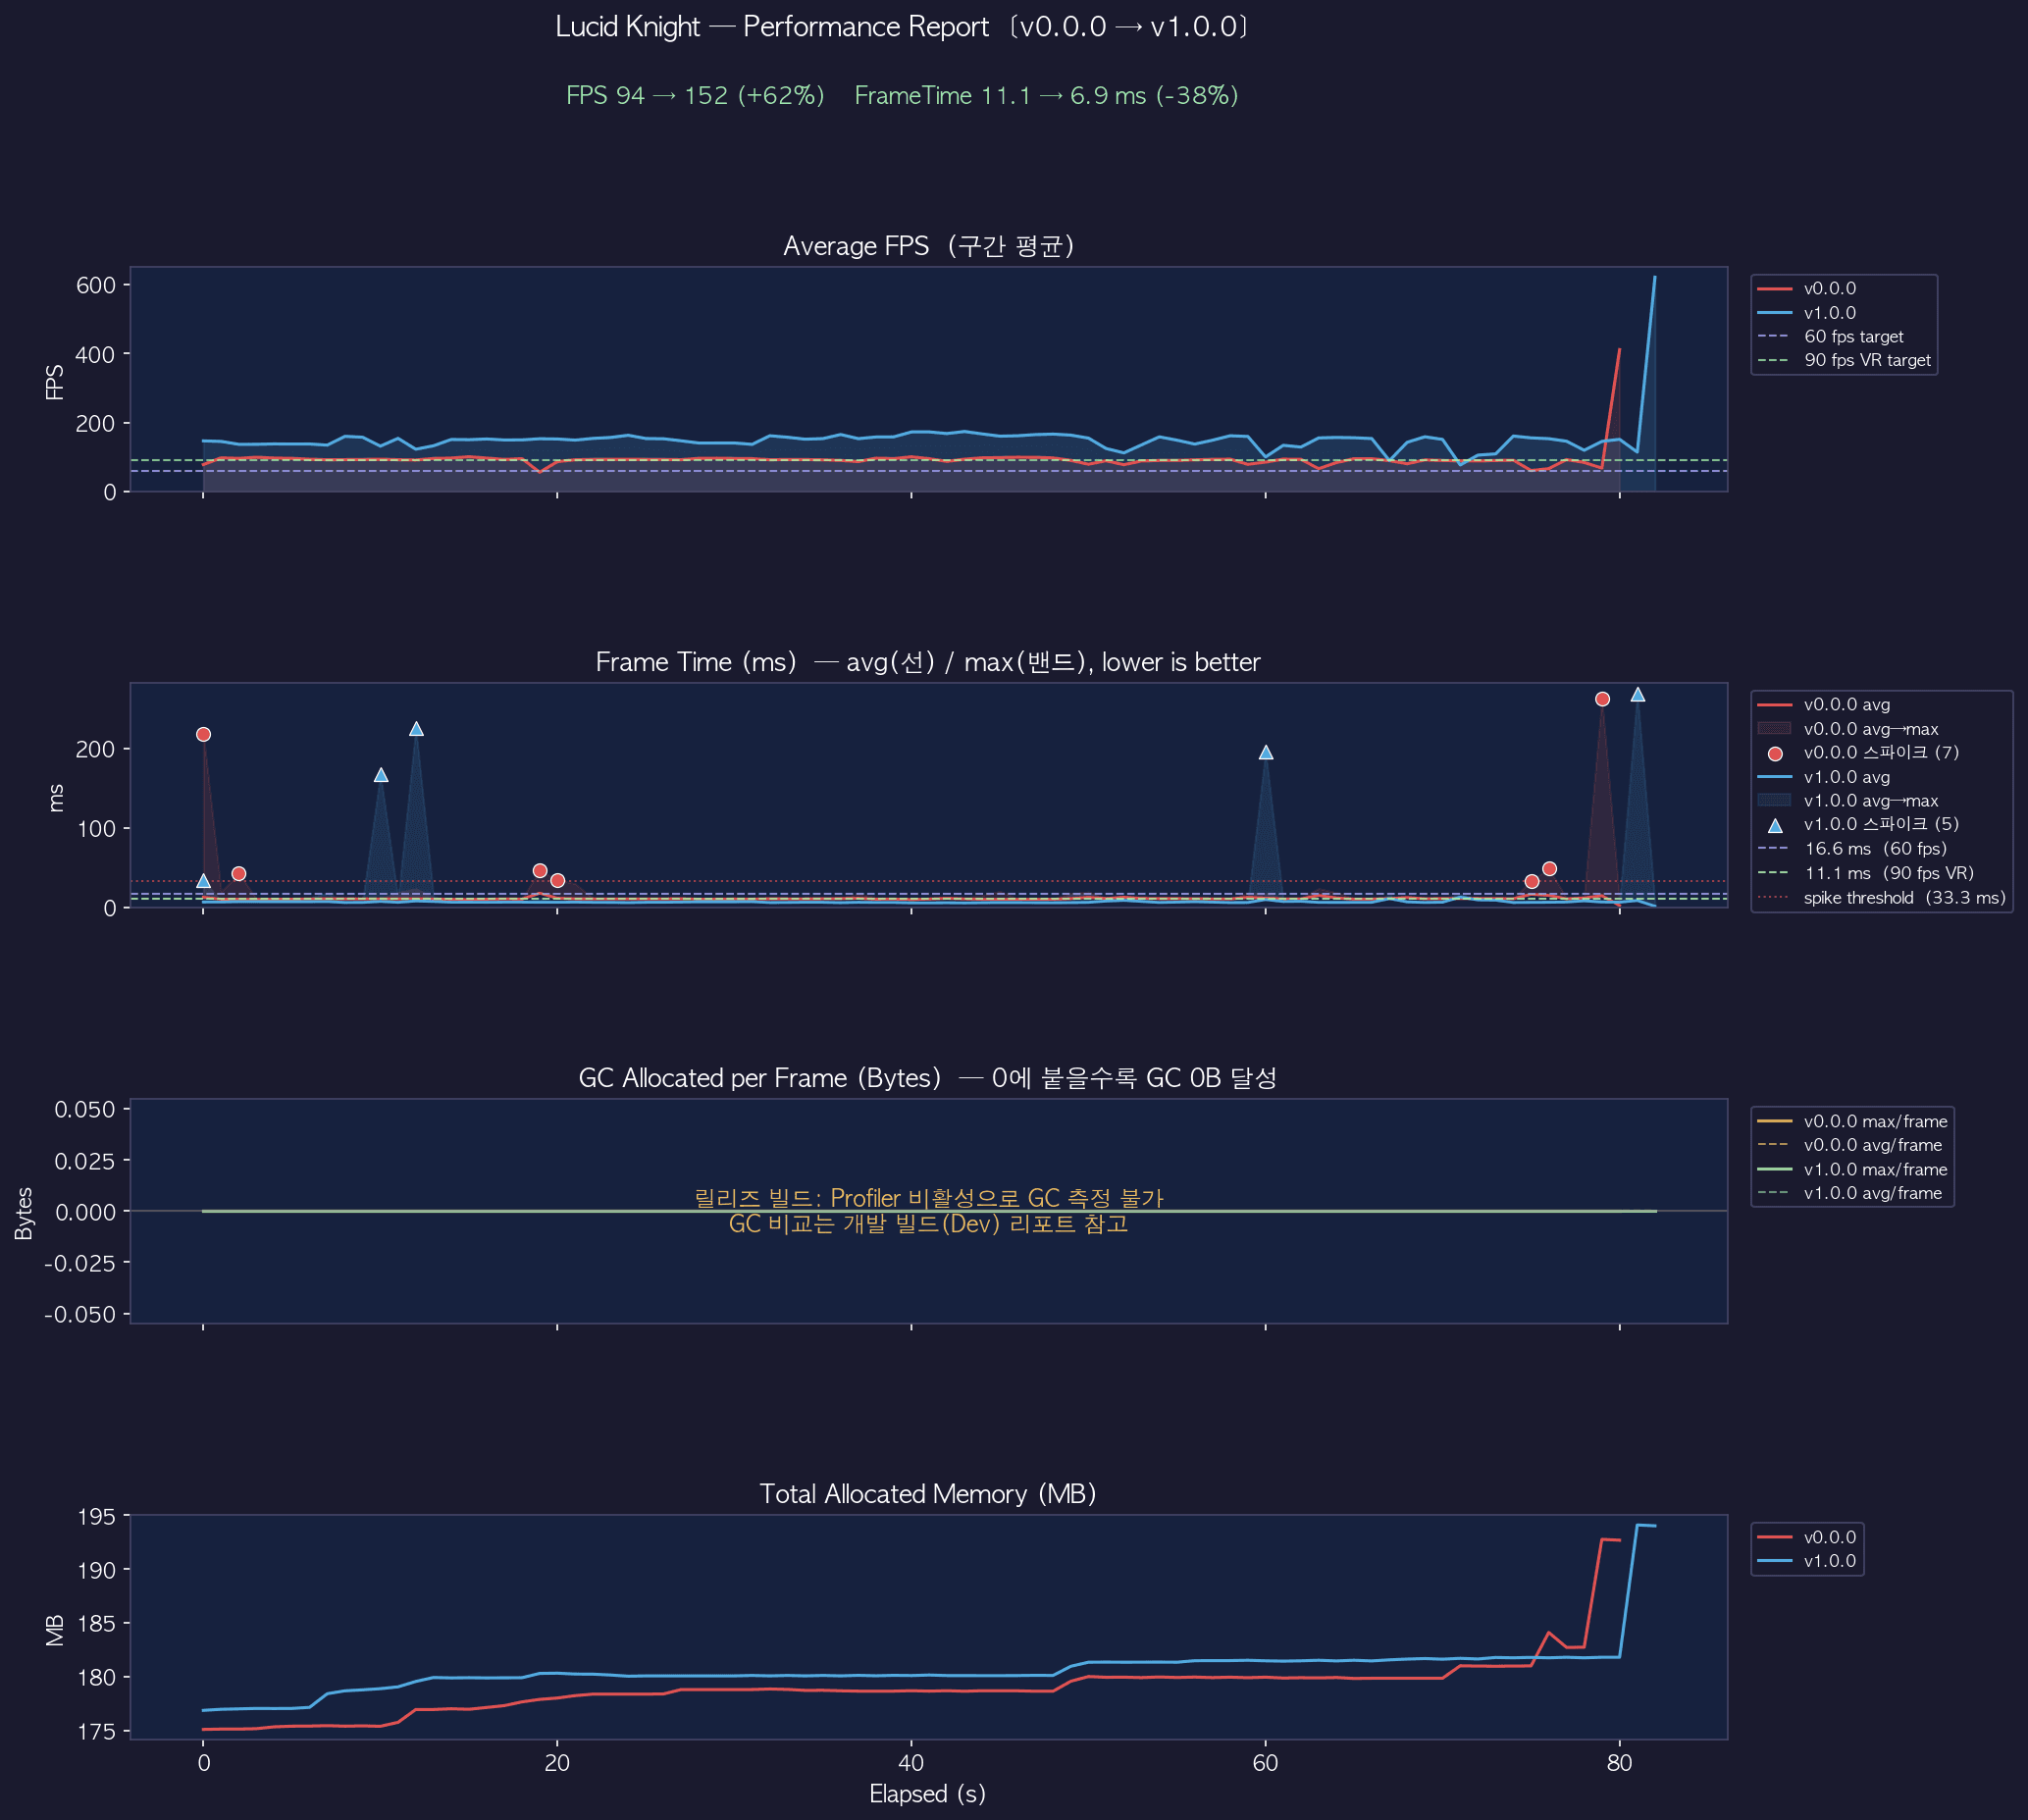
94 FPS → 152 FPSAverage FPS · +62%
11.1 ms → 6.9 msAverage frame time · −38%
454 B → 190 BGC allocation / frame · −58%
Optimization loop
Each fix started from evidence in the Profiler or custom telemetry, targeted one proven cause, and was verified on the same route and build type.
Rendering budget
Reduced over-specified URP shadows, cascades, and SSAO settings after GPU timing proved the scene was GPU-bound.
Overdraw
Reduced explosion particle counts after transparent fill-rate produced repeatable 27ms spikes.
Hot-path allocation
Introduced pooling, component caching, non-alloc physics queries, and removed logging from combat hot paths.
Failure analysis
The useful work began where the first explanation failed.
A snapshot was mistaken for a metric.
The original logger sampled one frame per second and treated Mono heap size as per-frame GC allocation. It was replaced with a logger reporting per-frame average, maximum, p95, and ProfilerRecorder allocation data to a writable output path.
Decision · repair the instrument before trusting the resultA transition skipped the event that ended an attack.
An animation event near the clip boundary was lost during transition. Moving the event earlier restored the state handoff without adding a timing guess in another system.
Decision · keep the state transition tied to animation evidenceRoot motion and code both moved the character.
Two movement owners produced teleport-like displacement. The fix was not another clamp; it was choosing one owner for each phase of motion.
Decision · one responsibility, one movement ownerGlobal time could remain frozen after failure.
A cleanup path around hit-stop and pause behavior was made explicit so an interrupted flow could not leave the game in a soft-locked global state.
Decision · recovery belongs in the execution modelSystem behavior
Performance work stayed connected to the game.
Claim boundary
Measured improvement, not a universal engine benchmark.
Average FPS and frame time were compared in release builds on the same route. GC allocation was compared separately under matching development-build conditions.
The numbers do not generalize to every scene, device, or Unity project. GC allocation cannot be measured in release builds—ProfilerRecorder is unavailable there—so a release build showing zero is not proof of zero allocation.